

Author

admin

Browsing

The S&P 500 ($SPX) just logged its fifth straight trading box breakout, which means that, of the five trading ranges the index has experienced since the April lows, all have been resolved to the upside.

How much longer can this last? That’s been the biggest question since the massive April 9 rally. Instead of assuming the market is due to roll over, it’s been more productive to track price action and watch for potential changes along the way. So far, drawdowns have been minimal, and breakouts keep occurring. Nothing in the price action hints at a lasting change — yet.

While some are calling this rally “historic,” we have a recent precedent. Recall that from late 2023 through early 2024, the index had a strong start and gave way to a consistent, steady trend.

From late October 2023 through March 2024, the S&P 500 logged seven consecutive trading box breakouts. That streak finally paused with a pullback from late March to early April, which, as we now know, was only a temporary hiccup. Once the bid returned, the S&P 500 went right back to carving new boxes and climbing higher.

New 52-Week Highs Finally Picking Up

If there’s been one gripe about this rally, it’s that the number of new highs within the index has lagged. As we’ve discussed before, among all the internal breadth indicators available, new highs almost always lag — that’s normal. What we really want to see is whether the number of new highs begins to exceed prior peaks as the market continues to rise, which it has, as shown by the blue line in the chart below.

As of Wednesday’s close, 100 S&P 500 stocks were either at new 52-week highs or within 3% of them. That’s a strong base. We expect this number to continue rising as the market climbs, especially if positive earnings reactions persist across sectors.

Even when we get that first day with 100+ S&P 500 stocks making new 52-week highs, though, it might not be the best time to initiate new longs.

The above chart shows that much needs to align for that many stocks to peak in unison, which has historically led to at least a short-term consolidation, if not deeper pullbacks — as highlighted in yellow. Every time is different, of course, but this is something to keep an eye on in the coming weeks.

Trend Check: GoNoGo Still “Go”

The GoNoGo Trend remains in bullish mode, with the recent countertrend signals having yet to trigger a greater pullback.

Active Bullish Patterns

We still have two live bullish upside targets of 6,555 and 6,745, which could be with us for a while going forward. For the S&P 500 to get there, it will need to form new, smaller versions of the trading boxes.

Failed Bearish Patterns

In the chart below, you can view a rising wedge pattern on the recent price action, the third since April. The prior two wedges broke down briefly and did not lead to a major downturn. The largest pullbacks in each case occurred after the S&P 500 dipped below the lower trendline of the pattern.

The deepest drawdown so far is 3.5%, which is not exactly a game-changer. Without downside follow-through, a classic bearish pattern simply can’t be formed, let alone be broken down from.

We’ll continue to monitor these formations as they develop because, at some point, that will change.
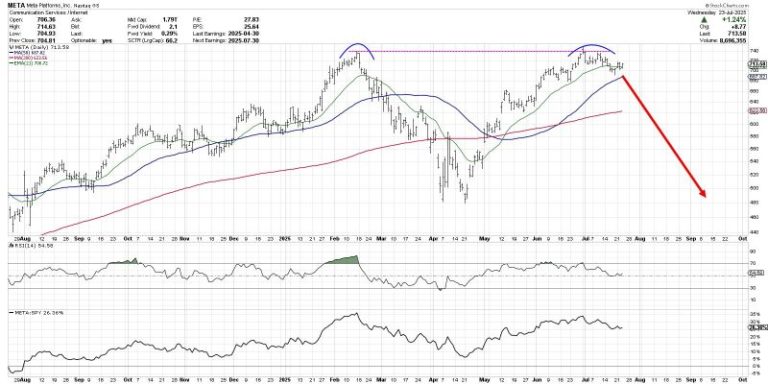
The chart of Meta Platforms, Inc. (META) has completed a roundtrip from the February high around $740 to the April low at $480 and all the way back again.  Over the last couple weeks, META has now pulled back from its retest of all-time highs, leaving investors to wonder what may come next.

Is this the beginning of a new downtrend phase for META?  Or just a brief pullback before a new uptrend phase propels META to new all-time highs?

Today we’ll look at two potential scenarios, including the double top pattern and the cup and handle pattern, and share which technical indicators and approaches could help us determine which path plays out into August.

The double top scenario basically means that the late July retest of the previous all-time high was the end of the recent uptrend phase.  The double top pattern is literally when a major resistance level is set and then retested.  The implication is that a lack of willing buyers means the uptrend is exhausted, and there is nowhere to go but down.

While the 21-day exponential moving average is currently in play for META, I would say that a break below the 50-day moving average could confirm this as the correct scenario.  If that smoothing mechanism does not hold, then the price action would imply less of a pullback and more like the beginning of a real distribution phase.

What is META pulls back but then resumes an uptrend phase, leading META to another new all-time high?  That would result in a confirmed cup and handle pattern, created by a large rounded bottoming pattern followed by a brief pullback.  The key to this pattern is the “rim” of the cup, which sits right at $740 for META.

Given the pullback META has demonstrated so far in July, I would say that a break above the $740 level would basically confirm a bullish cup and handle pattern.  That would suggest much more upside potential for META, as the stock would literally go into previously uncharted territory.

So how can we determine which scenario is more likely to play out?  This is where we need to incorporate more technical indicators into the discussion, as a way to further validate and confirm our investment thesis.

Just to review, I think a break above $740 would confirm a bullish cup and handle pattern.  I would also say that a break below the $680 level, which would represent a move below the 50-day moving average as well as the June swing lows, would basically confirm a bearish double top pattern.

We can also use the Relative Strength Index (RSI) to help determine whether META remains in a bullish trend phase.  During bull phases, the RSI rarely gets below 40, because buyers usually step in to “buy the dips” and keep the momentum fairly constructive.  So if the price would break down, and the RSI would not hold that crucial 40 level, that could mean a bearish outlook is warranted.

Finally, we can use volume-based indicators to assess whether moves in the price are supported by stronger volume readings.  Here I’ve included the Accumulation/Distribution Line, which tracks the trend in daily volume readings over time.  We can see that the high in July resulted in a divergence, as the A/D line was trending lower.  If the A/D line would break below its June and July lows, marked by a dashed red line, that would represent a bearish volume reading for META.

Technical analysis is less about predicting the future, and more about determining the most probable scenarios based on our analysis of trend, momentum, and volume.  I hope this discussion shows how the outlook for META can be easily determined and tracked using the best practices of technical analysis!

RR#6,

Dave

PS- Ready to upgrade your investment process?  Check out my free behavioral investing course!

David Keller, CMT

President and Chief Strategist

Sierra Alpha Research LLC

marketmisbehavior.com

https://www.youtube.com/c/MarketMisbehavior

Disclaimer: This blog is for educational purposes only and should not be construed as financial advice.  The ideas and strategies should never be used without first assessing your own personal and financial situation, or without consulting a financial professional.  

The author does not have a position in mentioned securities at the time of publication.    Any opinions expressed herein are solely those of the author and do not in any way represent the views or opinions of any other person or entity.

Markets don’t usually hit record highs, risk falling into bearish territory, and spring back to new highs within six months. But that’s what happened in 2025.

In this special mid-year recap, Grayson Roze sits down with David Keller, CMT, to show how disciplined routines, price-based signals, and a calm process helped them ride the whipsaw instead of getting tossed by it. You’ll see what really happened under the surface, how investor psychology drove the swings, and the exact StockCharts tools they leaned on to stay objective. 

If you’re focused on protecting capital, generating income, and sleeping well at night while still capturing the upside, this is a must-watch. Discover which charts deserve your attention now, what to ignore, and how to prep for the back half of 2025. 

This video premiered on July 23, 2025. Click on the above image to watch on our dedicated Grayson Roze page on StockCharts TV.

You can view previously recorded videos from Grayson at this link.

The stock market feels like it’s holding its breath ahead of Big Tech earnings. The first two days of the trading week were mostly quiet, but Tuesday gave us a few nuggets worth chewing on.

The S&P 500 ($SPX) squeaked out another record close, up by a modest +0.06%. It’s barely a blip, but it keeps the uptrend intact.

Tech momentum slowed down a tad, but we didn’t see a wave of selling. It was more like a little profit-taking after a strong run. No reason to hit the panic button just yet.


StockCharts Tip: Head to the Market Summary page and take a glance at the Market Factors panel. On Tuesday, Large-Cap Growth and Large-Cap Momentum were the only factors in the red (see image below).


FIGURE 1. MARKET FACTORS PANEL IN THE MARKET SUMMARY PAGE. Here you see the one-day performance metrics of the factors. You can change the timeframe using the dropdown menu at the top of the page. Image source: StockCharts.com. For educational purposes.

In the US Sectors panel in the Market Summary page, Technology was the lone S&P 500 sector that finished lower. Tuesday’s action can be seen in the StockCharts MarketCarpet of the S&P 500, based on a one-day performance.

FIGURE 2. MARKETCARPET FOR THE S&P 500. The Technology sector took a bit of a hit on Tuesday, but other sectors saw gains. Image source: StockCharts.com. For educational purposes.

The big names — NVIDIA (NVDA), Microsoft Corp. (MSFT), Amazon.com (AMZN), Meta Platforms (META), and Broadcom (AVGO) — were all in the laggard camp. This pause in tech stocks comes right before a wave of Big Tech earnings.

Some of the big tech companies reporting earnings this week are Alphabet, Inc. (GOOGL), Tesla, Inc. (TSLA), and International Business Machines (IBM). All three report on Wednesday after the close. If GOOGL and TSLA come in hot with solid numbers and upbeat guidance, the S&P 500 and Nasdaq Composite ($COMPQ) could catch a tailwind. (Fun fact: both stocks closed higher on Tuesday.)

Despite Tuesday’s tech wobble, major support levels are holding. The Nasdaq Composite remains comfortably above its 20-day exponential moving average (EMA), and breadth is improving (see chart below).

FIGURE 3. DAILY CHART OF THE NASDAQ COMPOSITE. The index is above its 20-day exponential moving average, and market breadth is improving. Chart source: StockCharts.com. For educational purposes.

Small Caps Still in the Game

We’re also seeing small-cap stocks rising. When small-caps participate in the market’s upside move, it’s an indication of a healthy stock market. Healthcare stocks represent a significant portion of the small-cap indexes, which explains why Health Care was the top-performing sector on Tuesday. 

Another area that stole the spotlight was homebuilders. The SPDR S&P Homebuilders ETF (XHB) broke above its 200-day simple moving average (SMA), a positive sign for the struggling industry group (see chart below). Its Relative Strength Index (RSI) indicates that momentum is relatively strong.

FIGURE 4. SPDR S&P HOMEBUILDERS ETF (XHB). The ETF broke above its 200-day simple moving average, and momentum is relatively strong. XHB has underperformed SPY over the last year. Chart source: StockCharts.com. For educational purposes.

Over the last year, XHB has lagged the SPDR S&P 500 ETF (SPY) by roughly 18%. Strong earnings from DR Horton, Inc. (DHI) and PulteGroup, Inc. (PHM), however, have given the group a welcome boost, even with a soft housing backdrop. We’ll get the June Existing Home Sales data on Wednesday. A stronger-than-expected report could add fuel to XHB’s rally.


StockCharts Tip: The XHB chart above is part of the  Market Summary ChartPack, which is free for StockCharts subscribers. Install it, and you’ll have a ready-to-use list of charts for days like this.


Also worth a peek is the U.S. Dow Jones Home Construction Index ($DJUSHB), which topped the Dow Industries list (check the US Industries panel in Market Summary and hit the Dow Industries tab).

Gold and Silver Nudge Higher

While tech cooled and home builders heated up, precious metals prices climbed higher. Gold ($GOLD) rose 0.92% and silver ($SILVER) gained 0.94%. Gold sits just under its all-time high, and silver is back to levels we haven’t seen since 2011.

The Big Picture: Still a Healthy Market Environment

None of Tuesday’s actions suggests a crack in the market’s growth story. We are in the thick of earnings season, and that always brings uncertainty and volatility. Expectations are high for Big Tech, especially in light of a weaker dollar. Stay patient, watch the price action, and let the charts guide your next move.


Disclaimer: This blog is for educational purposes only and should not be construed as financial advice. The ideas and strategies should never be used without first assessing your own personal and financial situation, or without consulting a financial professional.

In this video, Mary Ellen spotlights the areas driving market momentum following Taiwan Semiconductor’s record-breaking earnings report. She analyzes continued strength in semiconductors, utilities, industrials, and AI-driven sectors, plus highlights new leadership in robotics and innovation-focused ETFs like ARK. From there, Mary Ellen breaks down weakness in health care and housing stocks, shows how to refine trade entries using hourly charts, and compares today’s rally to past market surges. Watch as she explores setups in silver and examines individual stocks like Nvidia, BlackRock, and State Street.

This video originally premiered on July 18, 2025. You can watch it on our dedicated page for Mary Ellen’s videos.

New videos from Mary Ellen premiere weekly on Fridays. You can view all previously recorded episodes at this link.

If you’re looking for stocks to invest in, be sure to check out the MEM Edge Report! This report gives you detailed information on the top sectors, industries and stocks so you can make informed investment decisions.

In this video, Mary Ellen spotlights the areas driving market momentum following Taiwan Semiconductor’s record-breaking earnings report. She analyzes continued strength in semiconductors, utilities, industrials, and AI-driven sectors, plus highlights new leadership in robotics and innovation-focused ETFs like ARK. From there, Mary Ellen breaks down weakness in health care and housing stocks, shows how to refine trade entries using hourly charts, and compares today’s rally to past market surges. Watch as she explores setups in silver and examines individual stocks like Nvidia, BlackRock, and State Street.

This video originally premiered on July 18, 2025. You can watch it on our dedicated page for Mary Ellen’s videos.

New videos from Mary Ellen premiere weekly on Fridays. You can view all previously recorded episodes at this link.

If you’re looking for stocks to invest in, be sure to check out the MEM Edge Report! This report gives you detailed information on the top sectors, industries and stocks so you can make informed investment decisions.

In this video, Mary Ellen spotlights the areas driving market momentum following Taiwan Semiconductor’s record-breaking earnings report. She analyzes continued strength in semiconductors, utilities, industrials, and AI-driven sectors, plus highlights new leadership in robotics and innovation-focused ETFs like ARK. From there, Mary Ellen breaks down weakness in health care and housing stocks, shows how to refine trade entries using hourly charts, and compares today’s rally to past market surges. Watch as she explores setups in silver and examines individual stocks like Nvidia, BlackRock, and State Street.

This video originally premiered on July 18, 2025. You can watch it on our dedicated page for Mary Ellen’s videos.

New videos from Mary Ellen premiere weekly on Fridays. You can view all previously recorded episodes at this link.

If you’re looking for stocks to invest in, be sure to check out the MEM Edge Report! This report gives you detailed information on the top sectors, industries and stocks so you can make informed investment decisions.

In this video, Mary Ellen spotlights the areas driving market momentum following Taiwan Semiconductor’s record-breaking earnings report. She analyzes continued strength in semiconductors, utilities, industrials, and AI-driven sectors, plus highlights new leadership in robotics and innovation-focused ETFs like ARK. From there, Mary Ellen breaks down weakness in health care and housing stocks, shows how to refine trade entries using hourly charts, and compares today’s rally to past market surges. Watch as she explores setups in silver and examines individual stocks like Nvidia, BlackRock, and State Street.

This video originally premiered on July 18, 2025. You can watch it on our dedicated page for Mary Ellen’s videos.

New videos from Mary Ellen premiere weekly on Fridays. You can view all previously recorded episodes at this link.

If you’re looking for stocks to invest in, be sure to check out the MEM Edge Report! This report gives you detailed information on the top sectors, industries and stocks so you can make informed investment decisions.

The remains of a famous sycamore tree, which stood on Britain’s Roman-built Hadrian’s Wall in northern England for more than 200 years, has found a new home nearly two years after it was illegally felled.

The removal of the tree from its spot known as “Sycamore Gap,” a pronounced dip in Hadrian’s Wall, in September 2023 sparked global outrage. Sycamore Gap was considered one of the most photographed trees in England and was made famous to millions when it appeared in Kevin Costner’s 1991 blockbuster film “Robin Hood: Prince Of Thieves.”

In May, two men were found guilty of criminal damage for felling the landmark tree.

Now, a section of it will be put on permanent display at The Sill: National Landscape Discovery Centre, about two miles (three kilometers) from where it once stood.

The UK’s National Trust gave the largest remaining piece of the salvaged trunk to the Northumberland National Park, where the tree was located.

“In the days and months after the tree was felled, The Sill became a place of celebration and memory. Visitors left post-it notes, letters, drawings and messages expressing grief, love, and hope,” the park said in a press release Thursday.

A public consultation was held in the aftermath of the felling on the future of the tree trunk. “The resulting exhibit honours the tree’s natural form while inviting people to engage with it in a deeply personal way,” The Sill said in a press release Thursday.

Tree trunk ‘is huggable’

The trunk is positioned upright, as it once was, and is surrounded by tree oak benches and streams of wood bent to form a canopy in the shape of a huge leaf – recreating the shelter the tree once offered for people to sit and reflect.

Some tributes from the local community have been carved into the wood.

“The original tree may be gone in the form we knew it, but its legacy remains, and what has come since has been endlessly positive, affirming our belief that people nature and place cannot be separated and are interdependent,” said Tony Gates, chief executive of Northumberland National Park Authority, in the release.

“This commission has been the biggest honour of my career,” said Charlie Whinney, the artist behind the new exhibition, in the release.

“I really hope what we’ve done in some small way allows the people of Northumberland and those who held this tree close to their hearts to process the loss they still feel from that day in September 2023, when the tree was illegally cut down,” he added.

“The work looks forward with hope, the tree is regrowing, and Sycamore Gap will always be a magical place to visit,” Whinney continued.

This post appeared first on cnn.com

Australian universities may lose funding if they’re not judged to be doing enough to address anti-Jewish hate crimes, according to new measures proposed by the country’s first antisemitism envoy.

Jillian Segal was appointed to the role a year ago in response to a surge in reports of attacks against Jewish sites and property in Australia, following Israel’s invasion of Gaza, and was tasked with combating antisemitism in the country.

Standing alongside Prime Minister Anthony Albanese Thursday, Segal released a report nine months in the making proposing strong measures, including the university funding threats and the screening of visa applicants for extremist views.

“The plan is not about special treatment for one community; it is about restoring equal treatment,” Segal said. “It’s about ensuring that every Australian, regardless of their background or belief, can live, work, learn and prosper in this country.”

Like in the United States, Australian campuses were once the hub of pro-Palestinian protests led by students who pitched tents demanding action to stop Israel’s assault on Gaza.

The campus protests dwindled after restrictions were tightened and some protesters were threatened with expulsion, a move condemned by the activists as an infringement on free speech.

Segal’s report said antisemitism had become “ingrained and normalised” within academia and university courses, as well as on campuses, and recommended universities be made subject to annual report cards assessing their effectiveness in combating antisemitism.

Universities Australia chief executive Luke Sheehy said the organization had been working “constructively” with the special envoy and its members would “consider the recommendations.”

“Academic freedom and freedom of expression are core to the university mission, but they must be exercised with responsibility and never as a cover for hate or harassment,” he said in a statement.

Surge in antisemitism

Antisemitic attacks in Australia surged 300% in the year following Israel’s invasion of Gaza in October 2023.

In the past week alone, the door of a synagogue was set on fire in Melbourne, forcing 20 occupants to flee by a rear exit, as nearby protesters shouting “Death to the IDF” – using the initials of the Israeli military – stormed an Israeli-owned restaurant.

A man is facing arson charges over the synagogue attack, and three people were charged Tuesday with assault, affray, riotous behavior and criminal damage over the restaurant raid.

The Executive Council of Australian Jewry, which Segal once led and is the umbrella organization for hundreds of Jewish community groups, said the report’s release “could not be more timely given the recent appalling events in Melbourne.”

However, the Jewish Council of Australia, which opposes Israel’s war in Gaza, voiced concerns about Segal’s plan, saying it carried the overtones of US President Donald Trump’s attempts to use funding as a means of control over institutions.

In a statement, the council criticized the plan’s “emphasis on surveillance, censorship, and punitive control over the funding of cultural and educational institutions,” adding that they were “measures straight out of Trump’s authoritarian playbook.”

Max Kaiser, the group’s executive officer, said: “Any response that treats antisemitism as exceptional, while ignoring Islamophobia, anti-Palestinian racism, and other forms of hate, is doomed to fail.”

Education, immigration and the arts

The envoy’s 20-page plan includes sweeping recommendations covering schools, immigration, media, policing and public awareness campaigns.

Segal wants Holocaust and antisemitism education baked into the national curriculum “as a major case study of where unchecked antisemitism can lead,” according to the report.

Arts organizations could be subject to the same restrictions as universities, with threats to pull public funding if they’re found to have engaged in, or facilitated, antisemitism.

“While freedom of expression, particularly artistic expression, is vital to cultural richness and should be protected, funding provided by Australian taxpayers should not be used to promote division or spread false/ distorted narratives,” the report said.

Under the recommendations, tougher immigration screening would weed out people with antisemitic views, and the Migration Act would enable authorities to cancel visas for antisemitic conduct.

Media would be monitored to “encourage accurate, fair and responsible reporting” and to “avoid accepting false or distorted narratives,” the report added.

During Thursday’s press conference, Albanese pointed to an interview on the country’s national broadcaster with a protester, saying the interviewee tried to justify the Melbourne restaurant attack.

“There is no justification for that whatsoever,” he said. “The idea that somehow the cause of justice for Palestinians is advanced by behavior like that is not only delusional, it is destructive, and it is not consistent with how you are able to put forward your views respectfully in a democracy,” he said.

Asked if the country had become less tolerant of different views and had, perhaps, lost the ability to have a debate, Albanese pointed to social media.

“I think there is an impact of social media, where algorithms work to reinforce people’s views,” he said. “They reinforce views, and they push people towards extremes, whether it be extreme left, extreme right. Australians want a country that is in the center.”

His comments came as Grok, X’s AI chatbot, was called out for spreading antisemitic tropes that the company said it was “actively working to remove.”

Albanese said, regarding antisemitic views, “social media has a social responsibility, and they need to be held to account.”

Asked whether anti-Israel protests were fueling the antisemitic attacks, the prime minister said people should be able to express their views without resorting to hate.

“In Israel itself, as a democracy, there is protest against actions of the government, and in a democracy, you should be able to express your view here in Australia about events overseas,” he said. “Where the line has been crossed is in blaming and identifying people because they happen to be Jewish.”

This post appeared first on cnn.com